Whether it’s planning for retirement, saving for a college fund or earning residual income, many individuals want to invest but often don’t know where, how or what might produce the best result.
While the stock market is a conventional approach to investing, there is another investment vehicle that could be more effective. Real estate investments offer an alternative to the stock market, and under the right circumstances, they are lower risk, generate better returns and offer greater diversification.
In 2018, Forbes teamed up with Local Market Monitor to monitor and compile a list of 20 markets where population, jobs and home prices are growing.
-
Orlando, Fla.
Average home price: $247,550
3-year population growth: 7.6%
2-year job growth: 7.1%
1-year home price growth: 9%
3-year price growth forecast: 35%
-
Provo-Orem, Utah
Average home price: $266,169
3-year population growth: 7.2%
2-year job growth: 6.7%
1-year home price growth: 10%
3-year price growth forecast: 31%
-
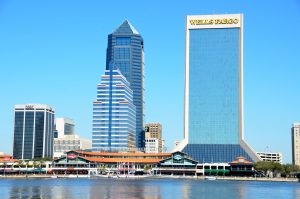
Jacksonville, Fla.
Average home price: $247,809
3-year population growth: 5.9%
2-year job growth: 6.1%
1-year home price growth: 8%
3-year price growth forecast: 20%
-
Raleigh-Durham, N.C.
Average home price: $274,980
3-year population growth: 4.9%
2-year job growth: 5.8%
1-year home price growth: 8%
3-year price growth forecast: 26%
Homes are undervalued by 3% compared to the historic ratio of price and local income.
-
Ogden-Clearfield, Utah
Average home price: $246,251
3-year population growth: 5.1%
2-year job growth: 5.7%
1-year home price growth: 10%
3-year price growth forecast: 29%
-
Nashville-Davidson-Murfreesboro, Tenn.
Average home price: $277,842
3-year population growth: 6.1%
2-year job growth: 5.5%
1-year home price growth: 10%
3-year price growth forecast: 27%
-
Atlanta-Sandy Springs-Marietta, Ga.
Average home price: $234,249
3-year population growth: 4.9%
2-year job growth: 5.1%
1-year home price growth: 8%
3-year price growth forecast: 24%
Homes are undervalued by 7% compared to the historic ratio of price and local income.
-
Springfield, Mo.
Average home price: $154,557
3-year population growth: 2.3%
2-year job growth: 5.1%
1-year home price growth: 5%
3-year price growth forecast: 14%
Homes are undervalued by 17% compared to the historic ratio of price and local income.
-
Fort Worth-Arlington, Texas
Average home price: $235,398
3-year population growth: 5.6%
2-year job growth: 5.0%
1-year home price growth: 11%
3-year price growth forecast: 26%
-
Sacramento-Arden-Arcade-Roseville, Calif.
Average home price: $327,073
3-year population growth: 3.7%
2-year job growth: 4.8%
1-year home price growth: 10%
3-year price growth forecast: 33%
-
Grand Rapids-Wyoming, Mich.
Average home price: $188,297
3-year population growth: 2.8%
2-year job growth: 4.7%
1-year home price growth: 10%
3-year price growth forecast: 25%
Homes are undervalued by 7% compared to the historic ratio of price and local income.
-
San Antonio, Texas
Average home price: $232,025
3-year population growth: 6.5%
2-year job growth: 4.6%
1-year home price growth: 7%
3-year price growth forecast: 20%
-
Boston Metropolitan Area
Average home price: $403,542
3-year population growth: 2.2%
2-year job growth: 4.5%
1-year home price growth: 8%
3-year price growth forecast: 18%
-
Fayetteville-Springdale-Rogers, Ark.-Mo.
Average home price: $197,952
3-year population growth: 6.5%
2-year job growth: 4.4%
1-year home price growth: 8%
3-year price growth forecast: 31%
Homes are undervalued by 24% compared to the historic ratio of price and local income.
-
Augusta-Richmond County, Ga.-S.C.
Average home price: $185,172
3-year population growth: 2.6%
2-year job growth: 4.1%
1-year home price growth: 6%
3-year price growth forecast: 16%
Homes are undervalued by 15% compared to the historic ratio of price and local income.
-
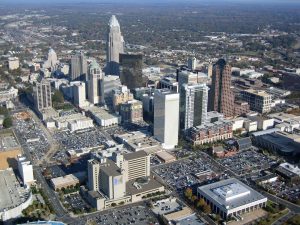
Charlotte-Gastonia-Concord, N.C.-S.C.
Average home price: $260,473
3-year population growth: 6.0%
2-year job growth: 4.0%
1-year home price growth: 9%
3-year price growth forecast: 22%
-
Washington Metropolitan Area
Average home price: $393,816
3-year population growth: 3.0%
2-year job growth: 3.9%
1-year home price growth: 5%
3-year price growth forecast: 11%
-
Minneapolis Metropolitan Area
Average home price: $257,817
3-year population growth: 2.7%
2-year job growth: 3.9%
1-year home price growth: 8%
3-year price growth forecast: 21%
-
Des Moines, Iowa
Average home price: $197,675
3-year population growth: 5.8%
2-year job growth: 3.6%
1-year home price growth: 6%
3-year price growth forecast: 17%
Homes are undervalued by 10% compared to the historic ratio of price and local income.
-
Columbus, Ohio
Average home price: $229,776
3-year population growth: 3.6%
2-year job growth: 3.1%
1-year home price growth: 8%
3-year price growth forecast: 21%
Homes are undervalued by 13% compared to the historic ratio of price and local income.
National
Average home price: $283,900
3-year population growth: 2.6%
2-year job growth: 3.0%
1-year home price growth: 6%
3-year price growth forecast: 14%
